We started shipping monitoring after a string of outages where customers paged us before our own dashboards did. This is the stack we landed on, written like you're standing it up tomorrow.
why Prometheus and Grafana
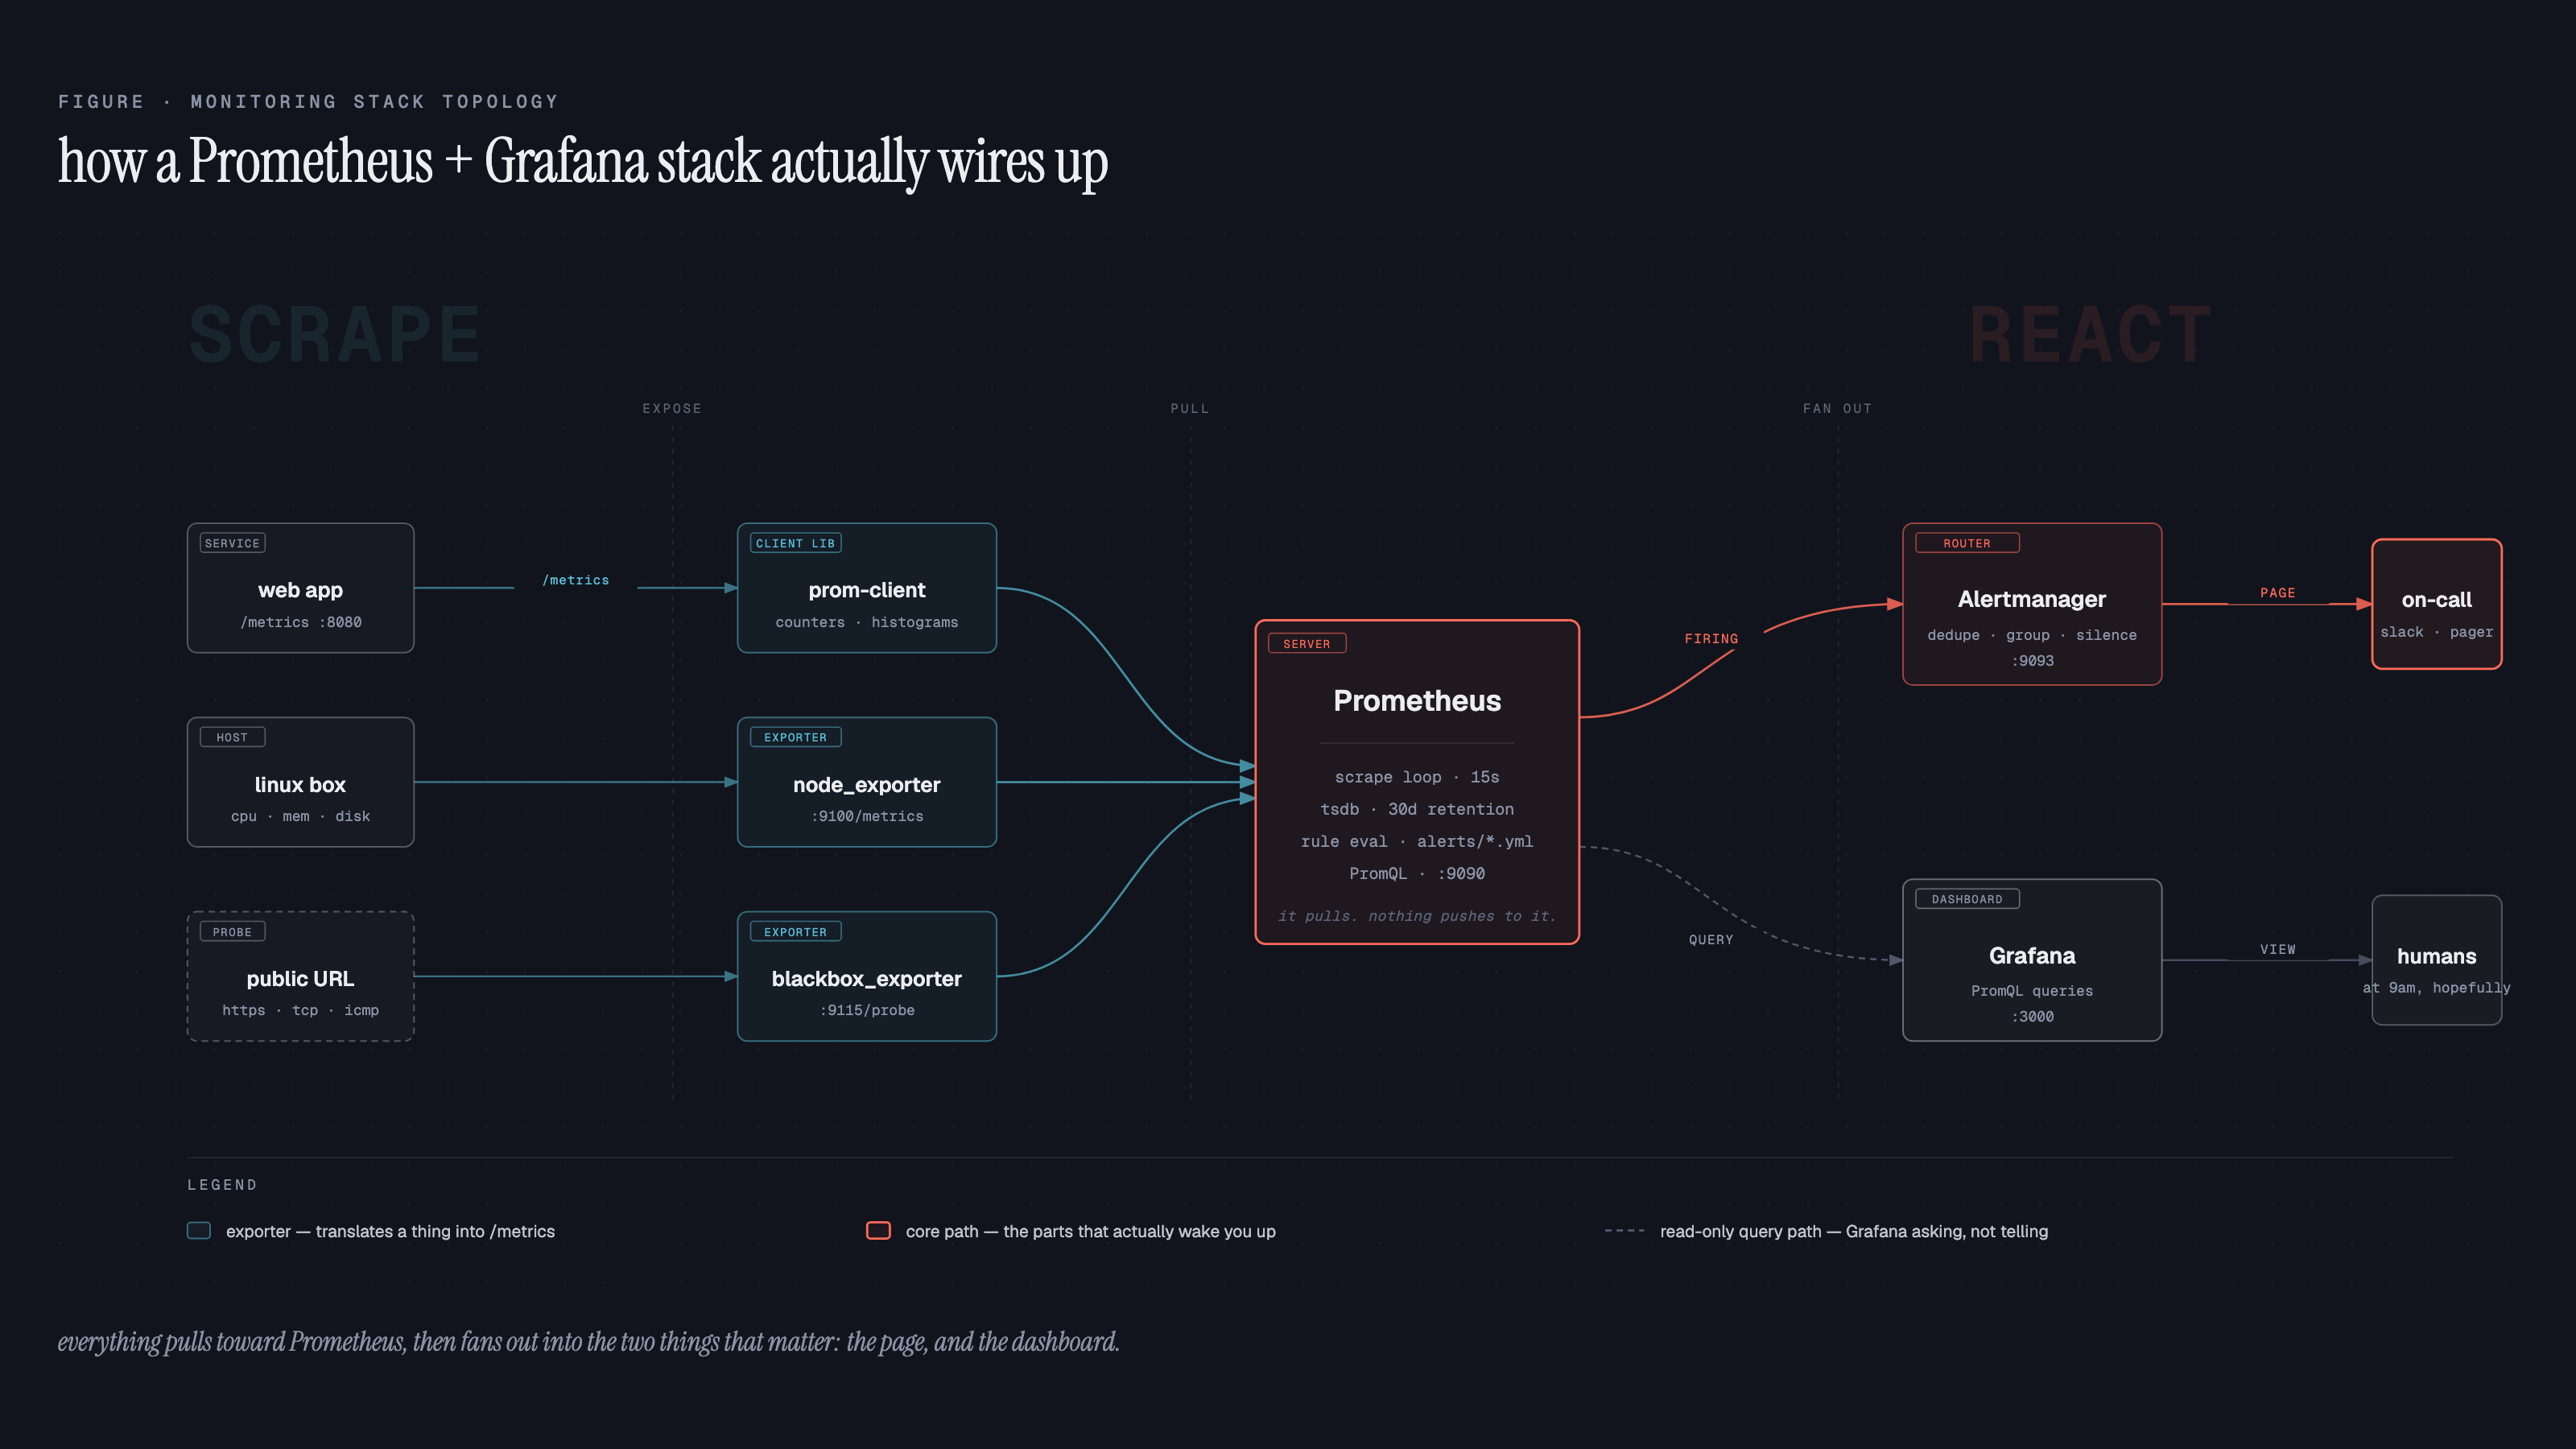
After trying CloudWatch, Datadog, and New Relic, we landed on Prometheus and Grafana for the same reason most teams do. Prometheus is open source and pull-based, and it fits Kubernetes without protest. Grafana puts the dashboards on top, talks to almost anything, and costs nothing. Self-hosted, the bill is server time. The commercial options were running us $500 a month and climbing.
setup with Docker Compose
For development or small deployments, Docker Compose is perfect:
services:
  prometheus:
    image: prom/prometheus:latest
    container_name: prometheus
    volumes:
      - ./prometheus.yml:/etc/prometheus/prometheus.yml
      - prometheus_data:/prometheus
    command:
      - '--config.file=/etc/prometheus/prometheus.yml'
      - '--storage.tsdb.path=/prometheus'
      - '--storage.tsdb.retention.time=30d'
    ports:
      - "9090:9090"
    restart: unless-stopped

  grafana:
    image: grafana/grafana:latest
    container_name: grafana
    volumes:
      - grafana_data:/var/lib/grafana
      - ./grafana/provisioning:/etc/grafana/provisioning
    environment:
      - GF_SECURITY_ADMIN_PASSWORD=changeme
      - GF_USERS_ALLOW_SIGN_UP=false
    ports:
      - "3000:3000"
    restart: unless-stopped
    depends_on:
      - prometheus

  node_exporter:
    image: prom/node-exporter:latest
    container_name: node_exporter
    command:
      - '--path.procfs=/host/proc'
      - '--path.sysfs=/host/sys'
      - '--collector.filesystem.mount-points-exclude=^/(sys|proc|dev|host|etc)($$|/)'
    volumes:
      - /proc:/host/proc:ro
      - /sys:/host/sys:ro
      - /:/rootfs:ro
    ports:
      - "9100:9100"
    restart: unless-stopped

volumes:
  prometheus_data:
  grafana_data:
Run it:
docker-compose up -dDone. Prometheus is on :9090, Grafana on :3000.
prometheus configuration
Create prometheus.yml:
global:
  scrape_interval: 15s
  evaluation_interval: 15s
  external_labels:
    cluster: 'production'
    region: 'us-east-1'

# Alertmanager configuration (we'll get to this)
alerting:
  alertmanagers:
    - static_configs:
        - targets: ['alertmanager:9093']

# Load rules
rule_files:
  - 'alerts/*.yml'

# Scrape configurations
scrape_configs:
  # Prometheus itself
  - job_name: 'prometheus'
    static_configs:
      - targets: ['localhost:9090']

  # Node metrics (CPU, memory, disk)
  - job_name: 'node'
    static_configs:
      - targets: ['node_exporter:9100']
        labels:
          instance: 'production-server-1'

  # Example: monitoring a web app
  - job_name: 'webapp'
    static_configs:
      - targets: ['webapp:8080']
    metrics_path: '/metrics'
instrumenting your application
Node.js / Express example
const express = require('express');
const promClient = require('prom-client');

const app = express();
const register = new promClient.Registry();

// Collect default metrics (CPU, memory, event loop)
promClient.collectDefaultMetrics({ register });

// Custom metrics
const httpRequestDuration = new promClient.Histogram({
  name: 'http_request_duration_seconds',
  help: 'Duration of HTTP requests in seconds',
  labelNames: ['method', 'route', 'status_code'],
  buckets: [0.1, 0.5, 1, 2, 5]
});

const httpRequestTotal = new promClient.Counter({
  name: 'http_requests_total',
  help: 'Total number of HTTP requests',
  labelNames: ['method', 'route', 'status_code']
});

register.registerMetric(httpRequestDuration);
register.registerMetric(httpRequestTotal);

// Middleware to track requests
app.use((req, res, next) => {
  const start = Date.now();

  res.on('finish', () => {
    const duration = (Date.now() - start) / 1000;
    const labels = {
      method: req.method,
      route: req.route?.path || req.path,
      status_code: res.statusCode
    };

    httpRequestDuration.observe(labels, duration);
    httpRequestTotal.inc(labels);
  });

  next();
});

// Metrics endpoint
app.get('/metrics', async (req, res) => {
  res.set('Content-Type', register.contentType);
  res.end(await register.metrics());
});

app.listen(8080, () => {
  console.log('Server running on :8080');
  console.log('Metrics available at /metrics');
});
Python / Flask example
from flask import Flask, request
from prometheus_client import Counter, Histogram, generate_latest
import time

app = Flask(__name__)

# Metrics
request_count = Counter(
    'http_requests_total',
    'Total HTTP requests',
    ['method', 'endpoint', 'status']
)

request_duration = Histogram(
    'http_request_duration_seconds',
    'HTTP request duration',
    ['method', 'endpoint']
)

@app.before_request
def before_request():
    request.start_time = time.time()

@app.after_request
def after_request(response):
    duration = time.time() - request.start_time

    request_count.labels(
        method=request.method,
        endpoint=request.endpoint,
        status=response.status_code
    ).inc()

    request_duration.labels(
        method=request.method,
        endpoint=request.endpoint
    ).observe(duration)

    return response

@app.route('/metrics')
def metrics():
    return generate_latest()

if __name__ == '__main__':
    app.run(host='0.0.0.0', port=8080)
the queries you'll actually use
CPU usage
# CPU usage percentage
100 - (avg by (instance) (rate(node_cpu_seconds_total{mode="idle"}[5m])) * 100)

# Per core
rate(node_cpu_seconds_total{mode!="idle"}[5m])
memory usage
# Memory usage percentage
(1 - (node_memory_MemAvailable_bytes / node_memory_MemTotal_bytes)) * 100

# Available memory
node_memory_MemAvailable_bytes / 1024 / 1024 / 1024
disk usage
# Disk usage percentage
(1 - (node_filesystem_avail_bytes / node_filesystem_size_bytes)) * 100

# Filter to only important mounts
(1 - (node_filesystem_avail_bytes{mountpoint="/"} / node_filesystem_size_bytes{mountpoint="/"})) * 100
HTTP request rate
# Requests per second
rate(http_requests_total[5m])

# By status code
sum by (status_code) (rate(http_requests_total[5m]))
HTTP latency
# 95th percentile latency
histogram_quantile(0.95, rate(http_request_duration_seconds_bucket[5m]))

# Average latency
rate(http_request_duration_seconds_sum[5m]) / rate(http_request_duration_seconds_count[5m])
grafana dashboards
import community dashboards
- Go to Grafana → Dashboards → Import
- Use these IDs:
- - 1860: Node Exporter Full
- - 3662: Prometheus 2.0 Overview
- - 7362: MySQL Overview
Or create custom dashboards with the queries above.
auto-provisioning the datasource
Create grafana/provisioning/datasources/prometheus.yml:
apiVersion: 1

datasources:
  - name: Prometheus
    type: prometheus
    access: proxy
    url: http://prometheus:9090
    isDefault: true
    editable: false
alerting that actually works
Create alerts/rules.yml:
groups:
  - name: system_alerts
    interval: 30s
    rules:
      # High CPU
      - alert: HighCPUUsage
        expr: 100 - (avg by (instance) (rate(node_cpu_seconds_total{mode="idle"}[5m])) * 100) > 80
        for: 5m
        labels:
          severity: warning
        annotations:
          summary: "High CPU usage on {{ $labels.instance }}"
          description: "CPU usage is {{ $value }}%"

      # High Memory
      - alert: HighMemoryUsage
        expr: (1 - (node_memory_MemAvailable_bytes / node_memory_MemTotal_bytes)) * 100 > 85
        for: 5m
        labels:
          severity: warning
        annotations:
          summary: "High memory usage on {{ $labels.instance }}"
          description: "Memory usage is {{ $value }}%"

      # Disk Space
      - alert: DiskSpaceLow
        expr: (1 - (node_filesystem_avail_bytes{mountpoint="/"} / node_filesystem_size_bytes{mountpoint="/"})) * 100 > 85
        for: 5m
        labels:
          severity: critical
        annotations:
          summary: "Disk space low on {{ $labels.instance }}"
          description: "Disk usage is {{ $value }}%"

      # Service Down
      - alert: ServiceDown
        expr: up == 0
        for: 1m
        labels:
          severity: critical
        annotations:
          summary: "Service {{ $labels.job }} is down"
          description: "{{ $labels.instance }} has been down for 1 minute"

      # High Error Rate
      - alert: HighErrorRate
        expr: (sum(rate(http_requests_total{status_code=~"5.."}[5m])) / sum(rate(http_requests_total[5m]))) * 100 > 5
        for: 5m
        labels:
          severity: critical
        annotations:
          summary: "High error rate detected"
          description: "Error rate is {{ $value }}%"
production considerations
data retention
Prometheus stores data locally. Retention is set via command-line flags (which is why the Compose example passes them in command:), not in prometheus.yml:
--storage.tsdb.retention.time=30d
--storage.tsdb.retention.size=50GB
For longer retention, use:
- Thanos: Distributed Prometheus
- Grafana Mimir: Multi-tenant, horizontally scalable Prometheus; the actively-maintained successor to Cortex
- VictoriaMetrics: Drop-in replacement, more efficient
high availability
Run multiple Prometheus instances with identical configs. Use a load balancer or Thanos for deduplication.
security
# Add basic auth
global:
  external_labels:
    cluster: 'production'

# In Grafana datasource
basicAuth: true
basicAuthUser: prometheus
basicAuthPassword: supersecret
Better: Put behind VPN or use mutual TLS.
common gotchas
Five things bite people in production. Scrape interval below 10s is almost never what you want and quietly burns disk. Too many labels balloon cardinality and your queries get slow before you notice. Pick the right metric type: Counter for monotonic, Gauge for point-in-time, Histogram for distributions, and not the other way around. Monitoring without alerting is a screensaver. And the inverse: too many alerts and the on-call learns to ignore them, which is worse than no alerts at all.
the golden signals
If you only monitor four things, monitor Google's golden signals: latency, traffic, errors, saturation. Latency is how long requests take. Traffic is request rate. Errors is the rate of failed requests. Saturation is how full the system is on CPU, memory, and disk. Everything else is a refinement on these four.
what to add next
Add exporters for the data stores you actually use: MySQL, Redis, Postgres, whichever queue you're on. Wire Alertmanager to Slack and PagerDuty so the alerts land somewhere a human reads. Write a one-line runbook link in every alert annotation so the page tells the on-call what to do. Back up the Prometheus data directory; the whole point of long retention is gone if a disk failure wipes it. A dashboard you never look at is graphs heating the data center.